Drug checking reports
We have three different types of results:
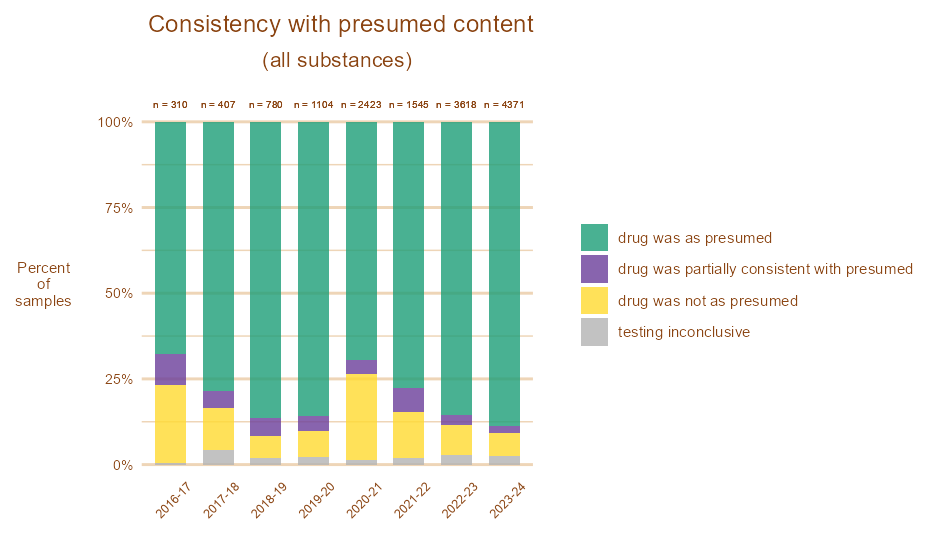
Annual results
The annual reports, published after our testing season which runs 1 April – 31 March.
These reports contain information on all substances we tested over the year by presumed and actual, as well as changes over time, and information on how people choose to consume them.
Interactive data
You can explore our testing results data interactively. You can see our results for one substance or a selection of substances. We also produce an interactive visualisation of what substances we have found each year.
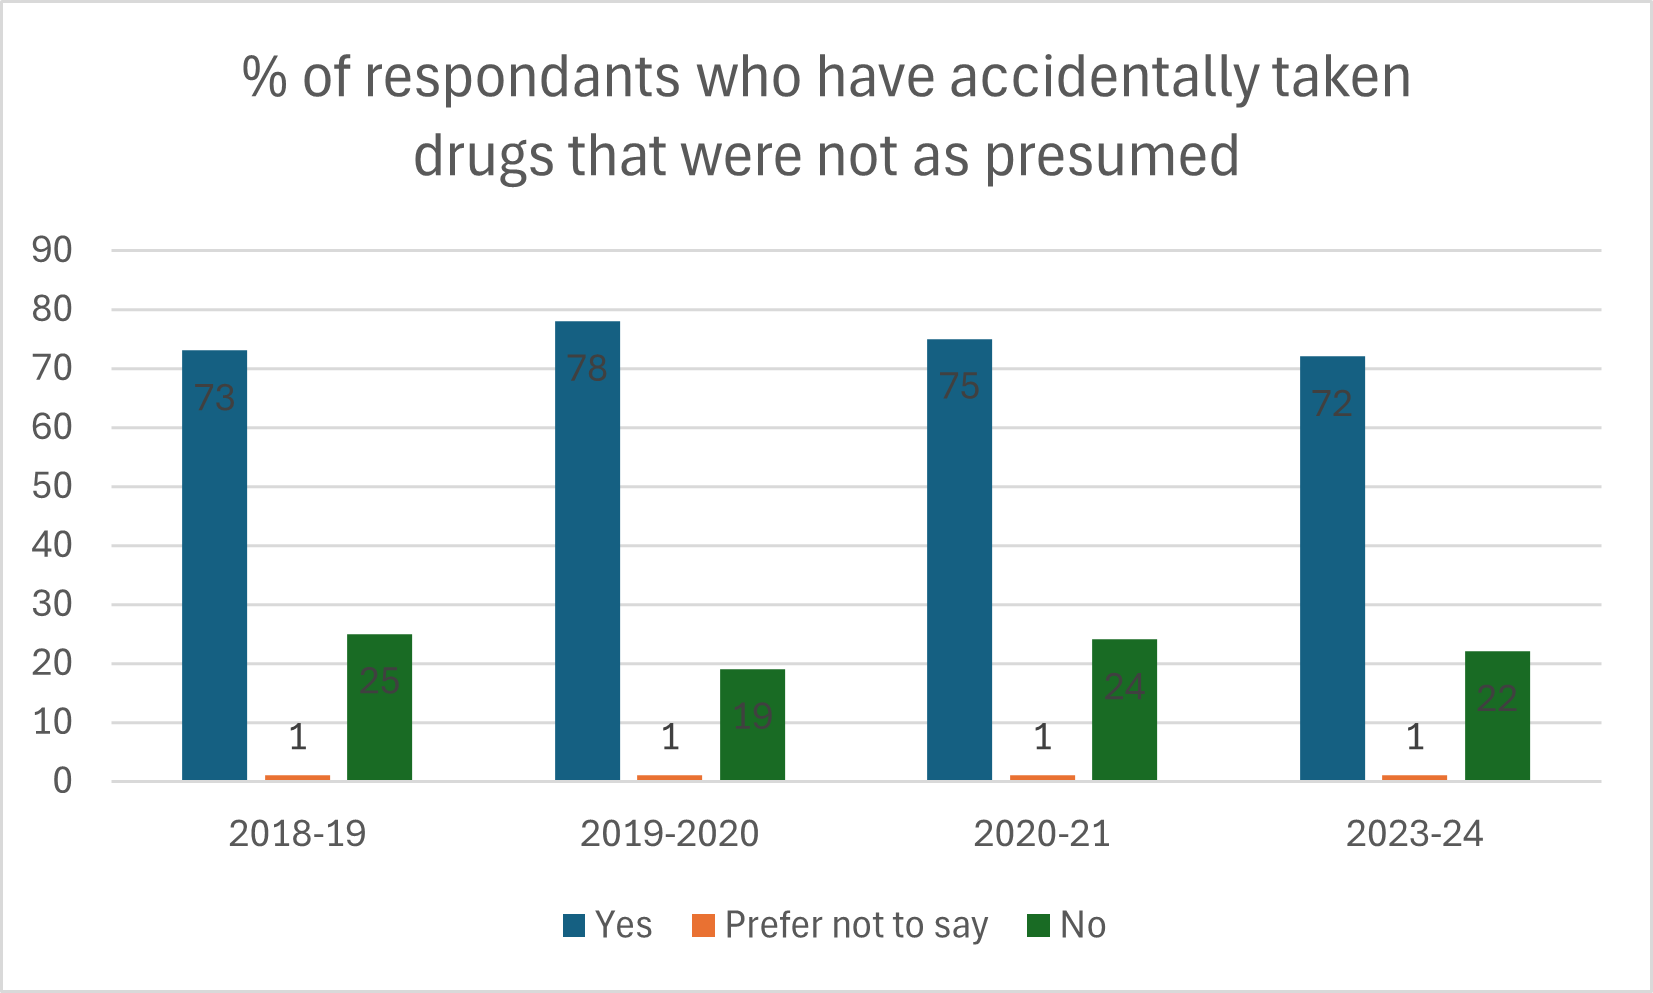
Client surveys
These reports are from our voluntary surveys which ask our clients questions about their drug-taking behaviour and how it is influenced by drug checking.


How to see the results
Select what year’s data you want to see, using the dropdown menu. Select ‘All’ to view the results summed across all years.
In the panel of checkboxes, select at least one substance from the list. This is what clients thought they had before their substance had been tested.
Once you have selected at least one substance, a chart and a table will appear. These show the testing results, i.e. what the substance actually turned out to contain. For example, if you select ‘Amphetamine’, you will see the testing results for all of the pills that were thought by clients to contain Amphetamine.
Results chart
The chart shows testing results grouped into drug families. These families are groupings of drugs that have similar structures and psychoactive effects.
Results table
The table shows the full list of drugs that were found (‘Drug’ column), the family that each drug is grouped into (‘Drug family’ column), and the number of samples that contained that drug (‘Number of samples’ column).
Selecting more than one presumed substance
If you select more than one presumed substance, the testing results will be added up across all of those presumed substances.